10753 Jefferson Avenue
Newport News, VA 23601
Listing ID: 306165
- Property Type Land : Retail Pad Site
- Lot Size Acres 1.440
- Land Sq Ft 62,726
- Land Price per Sq Ft $5.50


Description
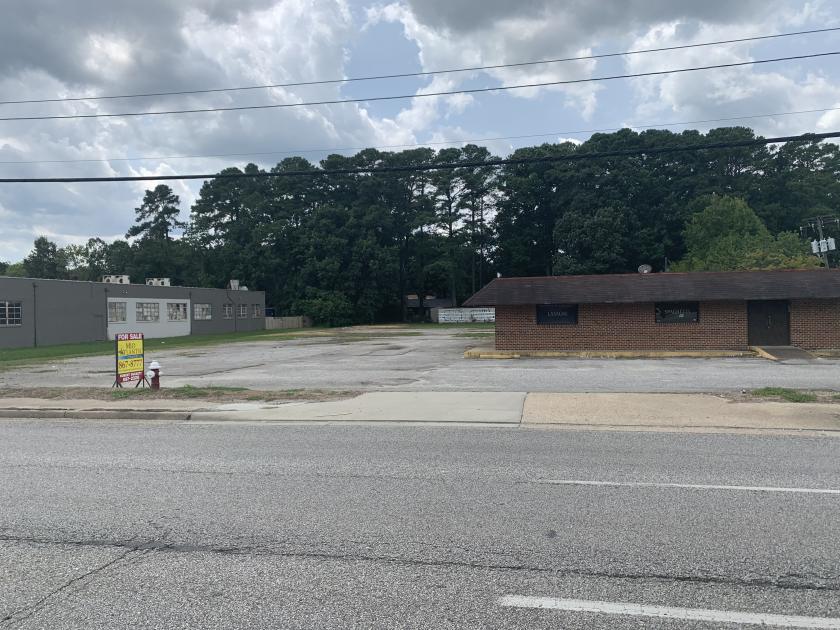
Excellent investment and development opportunity!
10751 & 10753 Jefferson Avenue for sale
• 1.44 acres total.
• C1 zoning.
• Properties feature both a right-turn entrance access and left-turn median break access from Jefferson Avenue.
• Owner will demolish and remove existing structure.
• Located in Newport News Enterprise Zone (VEZ) #3 / Development may be eligible for several economic incentives, rebates, or waivers.
Attachments & Files
Listing Demographics
Information based on the most recently available data (updated annually) and is provided in 1-mile, 3-mile, and 5-mile radii (radiuses) of the property location.
| 1-Mile | 3-Miles | 5-Miles | ||
|---|---|---|---|---|
| Total Population | 10,358 | 69,819 | 165,524 | |
| Population Median Age | 36 | 38 | 37 | |
| Population by Age | 0-9 Yrs | 1582 (15%) | 8274 (11%) | 20836 (12%) |
| 10-19 Yrs | 1327 (12%) | 9800 (14%) | 21660 (13%) | |
| 20-29 Yrs | 1367 (13%) | 10667 (15%) | 26442 (15%) | |
| 30-39 Yrs | 1554 (15%) | 10166 (14%) | 25176 (15%) | |
| 40-49 Yrs | 1430 (13%) | 7902 (11%) | 17924 (10%) | |
| 50-59 Yrs | 1552 (14%) | 9086 (13%) | 20637 (12%) | |
| 60-69 Yrs | 886 (8%) | 7483 (10%) | 17336 (10%) | |
| 70+ Yrs | 661 (6%) | 6440 (9%) | 15512 (9%) | |
| Median HH Income | $51,062 | $58,473 | $59,327 | |
| Total Household Income | < 24K | 768 (17%) | 5310 (18%) | 12887 (18%) |
| 25-49K | 1440 (32%) | 6826 (23%) | 16025 (23%) | |
| 50-74K | 835 (18%) | 5894 (20%) | 14212 (20%) | |
| 75-99K | 756 (16%) | 4017 (14%) | 9395 (13%) | |
| 100-199K | 639 (14%) | 5751 (20%) | 13492 (19%) | |
| 200K+ | 59 (1%) | 866 (3%) | 2586 (3%) | |
| Highest Education Level | No Diploma | 677 | 3517 | 8590 |
| Diploma or GED | 2029 | 13061 | 29760 | |
| Some College | 2066 | 11933 | 26627 | |
| Assoc. Degree | 664 | 4579 | 10867 | |
| Bachelors Degree | 993 | 7663 | 20583 | |
| Higher Degree | 592 | 5459 | 14108 | |
| Total Housing Units | 4,895 | 31,153 | 74,179 | |
| --Owner-Occupied | 2,085 | 15,301 | 33,951 | |
| --Renter-Occupied | 2,413 | 13,364 | 34,646 | |
| Owner-Occupied Values | < 100K | 60 | 702 | 2606 |
| 100-199K | 1250 | 7308 | 13482 | |
| 200-299K | 622 | 5173 | 10679 | |
| 300-399K | 70 | 1400 | 4369 | |
| 400-499K | 68 | 387 | 1601 | |
| 500K+ | 14 | 331 | 1213 | |
| Total Working Age Population | 7,894 | 56,669 | 132,066 | |
| In Work Force | 5,716 | 37,806 | 88,128 | |
| Not In Work Force | 2,178 | 18,863 | 43,938 | |
| Workforce Employed | 4,988 | 33,959 | 77,833 | |
| Workforce Unemployed | 276 | 2,328 | 4,720 | |
| Civlian Workforce | 5,264 | 36,287 | 82,553 | |
| Military Workforce | 452 | 1,519 | 5,575 | |
| Total Households | 4,498 | 28,665 | 68,597 | |
| Family Households | 2,663 | 16,967 | 40,634 | |
| Non-Family Households | 1,835 | 11,697 | 27,962 | |
| Married Couple | 1,481 | 10,854 | 25,752 | |
| Other Family | 1,182 | 6,113 | 14,882 | |
| Married w/Child | 621 | 3,541 | 9,178 | |
| Single Male w/Child | 262 | 970 | 1,845 | |
| Single Female w/Child | 351 | 2,498 | 6,741 | |
Population Change Last Two Decades - Plus Projection
| 2000 | % | 2010 | % | 2020 | % | 2030 | |
|---|---|---|---|---|---|---|---|
| Virginia | 7,078,515 | +13 | 8,001,024 | +8 | 8,655,021 | +8 | 9,331,666 |
| York County | 56,297 | +16 | 65,464 | +6 | 69,582 | +8 | 75,492 |
| Newport News city | 180,150 | 0 | 180,719 | 0 | 181,581 | -1 | 179,752 |
| Isle of Wight County | 29,728 | +19 | 35,270 | +8 | 38,060 | +10 | 41,823 |
| Hampton city | 146,437 | -6 | 137,436 | -1 | 135,530 | -6 | 127,842 |
No part of this information may be copied, reproduced, repurposed, or screen-captured for any commercial purpose without prior written authorization from MyEListing.
While we strive to provide the most accurate information, all listing information, and demographic data, is provided by third-parties. As such, MyEListing will not be responsible for the accuracy of the information. It is strongly recommended that you verify all information with the listing agent, and any relevant agencies, prior to making any decisions.
Listing Location & Map Views
Listing Agent

More listings from Robert Duckett


Featured Vendors