1800 Richmond Road
Williamsburg, VA 23185
Listing ID: 283845
- Property Type Land : Retail Land
- Lot Size Acres 2.600
- Land Sq Ft 113,256
- Land Price per Sq Ft $14.13

Property Highlights
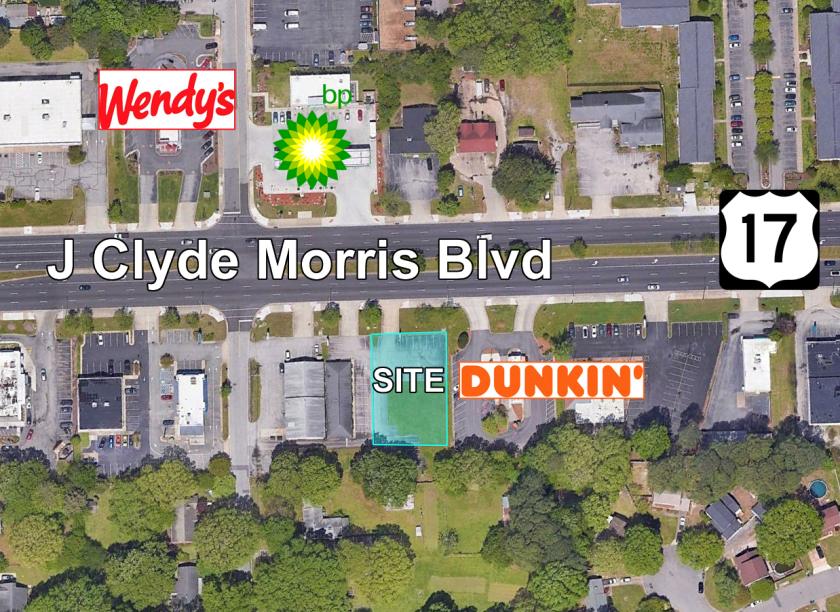
• Prime Williamsburg Location
Attachments & Files
Listing Demographics
Information based on the most recently available data (updated annually) and is provided in 1-mile, 3-mile, and 5-mile radii (radiuses) of the property location.
| 1-Mile | 3-Miles | 5-Miles | ||
|---|---|---|---|---|
| Total Population | 4,186 | 34,701 | 69,623 | |
| Population Median Age | 44 | 40 | 43 | |
| Population by Age | 0-9 Yrs | 278 (6%) | 3256 (9%) | 6614 (9%) |
| 10-19 Yrs | 433 (10%) | 4968 (14%) | 8903 (12%) | |
| 20-29 Yrs | 806 (19%) | 6570 (18%) | 10281 (14%) | |
| 30-39 Yrs | 477 (11%) | 3581 (10%) | 6722 (9%) | |
| 40-49 Yrs | 385 (9%) | 3275 (9%) | 7406 (10%) | |
| 50-59 Yrs | 520 (12%) | 3554 (10%) | 8452 (12%) | |
| 60-69 Yrs | 572 (13%) | 3820 (11%) | 9045 (12%) | |
| 70+ Yrs | 716 (17%) | 5676 (16%) | 12200 (17%) | |
| Median HH Income | $58,181 | $70,258 | $82,452 | |
| Total Household Income | < 24K | 440 (22%) | 2097 (16%) | 3481 (13%) |
| 25-49K | 332 (16%) | 2483 (19%) | 4294 (16%) | |
| 50-74K | 438 (22%) | 2202 (17%) | 4372 (16%) | |
| 75-99K | 309 (15%) | 1773 (13%) | 3690 (13%) | |
| 100-199K | 339 (17%) | 3041 (23%) | 7897 (29%) | |
| 200K+ | 115 (5%) | 1205 (9%) | 2760 (10%) | |
| Highest Education Level | No Diploma | 140 | 1257 | 2173 |
| Diploma or GED | 602 | 4078 | 8344 | |
| Some College | 394 | 3752 | 8146 | |
| Assoc. Degree | 220 | 1653 | 3981 | |
| Bachelors Degree | 768 | 5933 | 13462 | |
| Higher Degree | 869 | 5430 | 11577 | |
| Total Housing Units | 2,318 | 15,663 | 31,516 | |
| --Owner-Occupied | 973 | 7,356 | 18,474 | |
| --Renter-Occupied | 1,000 | 5,444 | 8,020 | |
| Owner-Occupied Values | < 100K | 44 | 161 | 387 |
| 100-199K | 349 | 1402 | 2585 | |
| 200-299K | 316 | 1982 | 5207 | |
| 300-399K | 116 | 1582 | 4395 | |
| 400-499K | 118 | 1045 | 2660 | |
| 500K+ | 31 | 1185 | 3241 | |
| Total Working Age Population | 3,758 | 29,825 | 59,115 | |
| In Work Force | 2,063 | 16,213 | 33,926 | |
| Not In Work Force | 1,695 | 13,611 | 25,189 | |
| Workforce Employed | 1,978 | 15,142 | 31,649 | |
| Workforce Unemployed | 61 | 762 | 1,601 | |
| Civlian Workforce | 2,039 | 15,904 | 33,251 | |
| Military Workforce | 24 | 309 | 675 | |
| Total Households | 1,973 | 12,801 | 26,495 | |
| Family Households | 828 | 7,405 | 17,353 | |
| Non-Family Households | 1,145 | 5,396 | 9,142 | |
| Married Couple | 642 | 5,852 | 14,419 | |
| Other Family | 185 | 1,553 | 2,934 | |
| Married w/Child | 142 | 1,621 | 4,087 | |
| Single Male w/Child | 37 | 268 | 561 | |
| Single Female w/Child | 86 | 598 | 1,005 | |
Population Change Last Two Decades - Plus Projection
| 2000 | % | 2010 | % | 2020 | % | 2030 | |
|---|---|---|---|---|---|---|---|
| Virginia | 7,078,515 | +13 | 8,001,024 | +8 | 8,655,021 | +8 | 9,331,666 |
| Gloucester County | 34,780 | +6 | 36,858 | +1 | 37,343 | +2 | 38,181 |
| James City County | 48,102 | +39 | 67,009 | +16 | 78,016 | +18 | 92,210 |
| Surry County | 6,829 | +3 | 7,058 | -8 | 6,501 | -3 | 6,282 |
| York County | 56,297 | +16 | 65,464 | +6 | 69,582 | +8 | 75,492 |
| Williamsburg city | 11,998 | +17 | 14,068 | +10 | 15,463 | +10 | 17,008 |
No part of this information may be copied, reproduced, repurposed, or screen-captured for any commercial purpose without prior written authorization from MyEListing.
While we strive to provide the most accurate information, all listing information, and demographic data, is provided by third-parties. As such, MyEListing will not be responsible for the accuracy of the information. It is strongly recommended that you verify all information with the listing agent, and any relevant agencies, prior to making any decisions.
Listing Location & Map Views
Listing Agent

More listings from Antonio Tedesco

Featured Vendors